iostat - Report Central Processing Unit (CPU) statistics and input/output statistics for devices and partitions. It is used for monitoring system input/output device loading by observing the time the devices are active in relation to their average transfer rates.The iostat command generates reports that can be used to change system configuration to better balance the input/output load between physical disks.
The first report generated by the iostat command provides statistics concerning the time since the system was booted, unless the -y option is used (in this case, this first report is omitted). Each subsequent report covers the time since the previous report.
Type the following command:
$iostat

REPORTS
The iostat command generates two types of reports, the CPU Utilization report and the Device Utilization report.
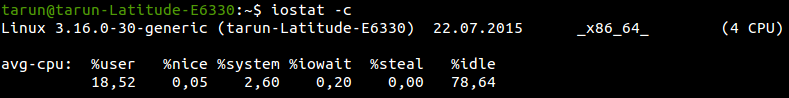
CPU Utilization Report - The first report generated by the iostat command is the CPU Utilization Report. For multiprocessor systems, the CPU values are global averages among all processors. The report has the following format:
%user shows the percentage of CPU utilization that occurred while executing at the user level (application).
%nice shows the percentage of CPU utilization that occurred while executing at the user level with nice priority.
%system shows the percentage of CPU utilization that occurred while executing at the system level (kernel).
%iowait shows the percentage of time that the CPU or CPUs were idle during which the system had an outstanding disk I/O request.
%steal shows the percentage of time spent in involuntary wait by the virtual CPU or CPUs while the hypervisor was servicing another virtual processor.
%idle shows the percentage of time that the CPU or CPUs were idle and the system did not have an outstanding disk I/O request.
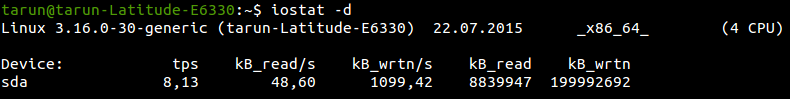
Device Utilization Report - The second report generated by the iostat command is the Device Utilization Report. The device report provides statistics on a per physical device or partition basis. Block devices and partitions for which statistics are to be displayed may be entered on the command line. If no device nor partition is entered, then statistics are displayed for every device used by the system. The report may show the following fields, depending on the flags used:
More on device file here - http://www.cyberciti.biz/faq/understanding-unix-linux-bsd-device-files/
More on device file here - http://www.cyberciti.biz/faq/understanding-unix-linux-bsd-device-files/
Device: This column gives the device (or partition) name as listed in the /dev directory. As you can see from snapshot above that I have only one device.
tps indicates the number of transfers per second that were issued to the device. A transfer is an I/O request to the device. Multiple logical requests can be combined into a single I/O request to the device.
Blk_read/s (kB_read/s, MB_read/s) indicates the amount of data read from the device expressed in a number of blocks (kilobytes, megabytes) per second. Blocks are equivalent to sectors and therefore have a size of 512 bytes.
Blk_wrtn/s (kB_wrtn/s, MB_wrtn/s) Indicate the amount of data written to the device expressed in a number of blocks (kilobytes, megabytes) per second.
Blk_read (kB_read, MB_read) The total number of blocks (kilobytes, megabytes) read.
OPTIONS
-c Display the CPU utilization report.
$ iostat -c
-d Display the device utilization report.
$ iostat -d