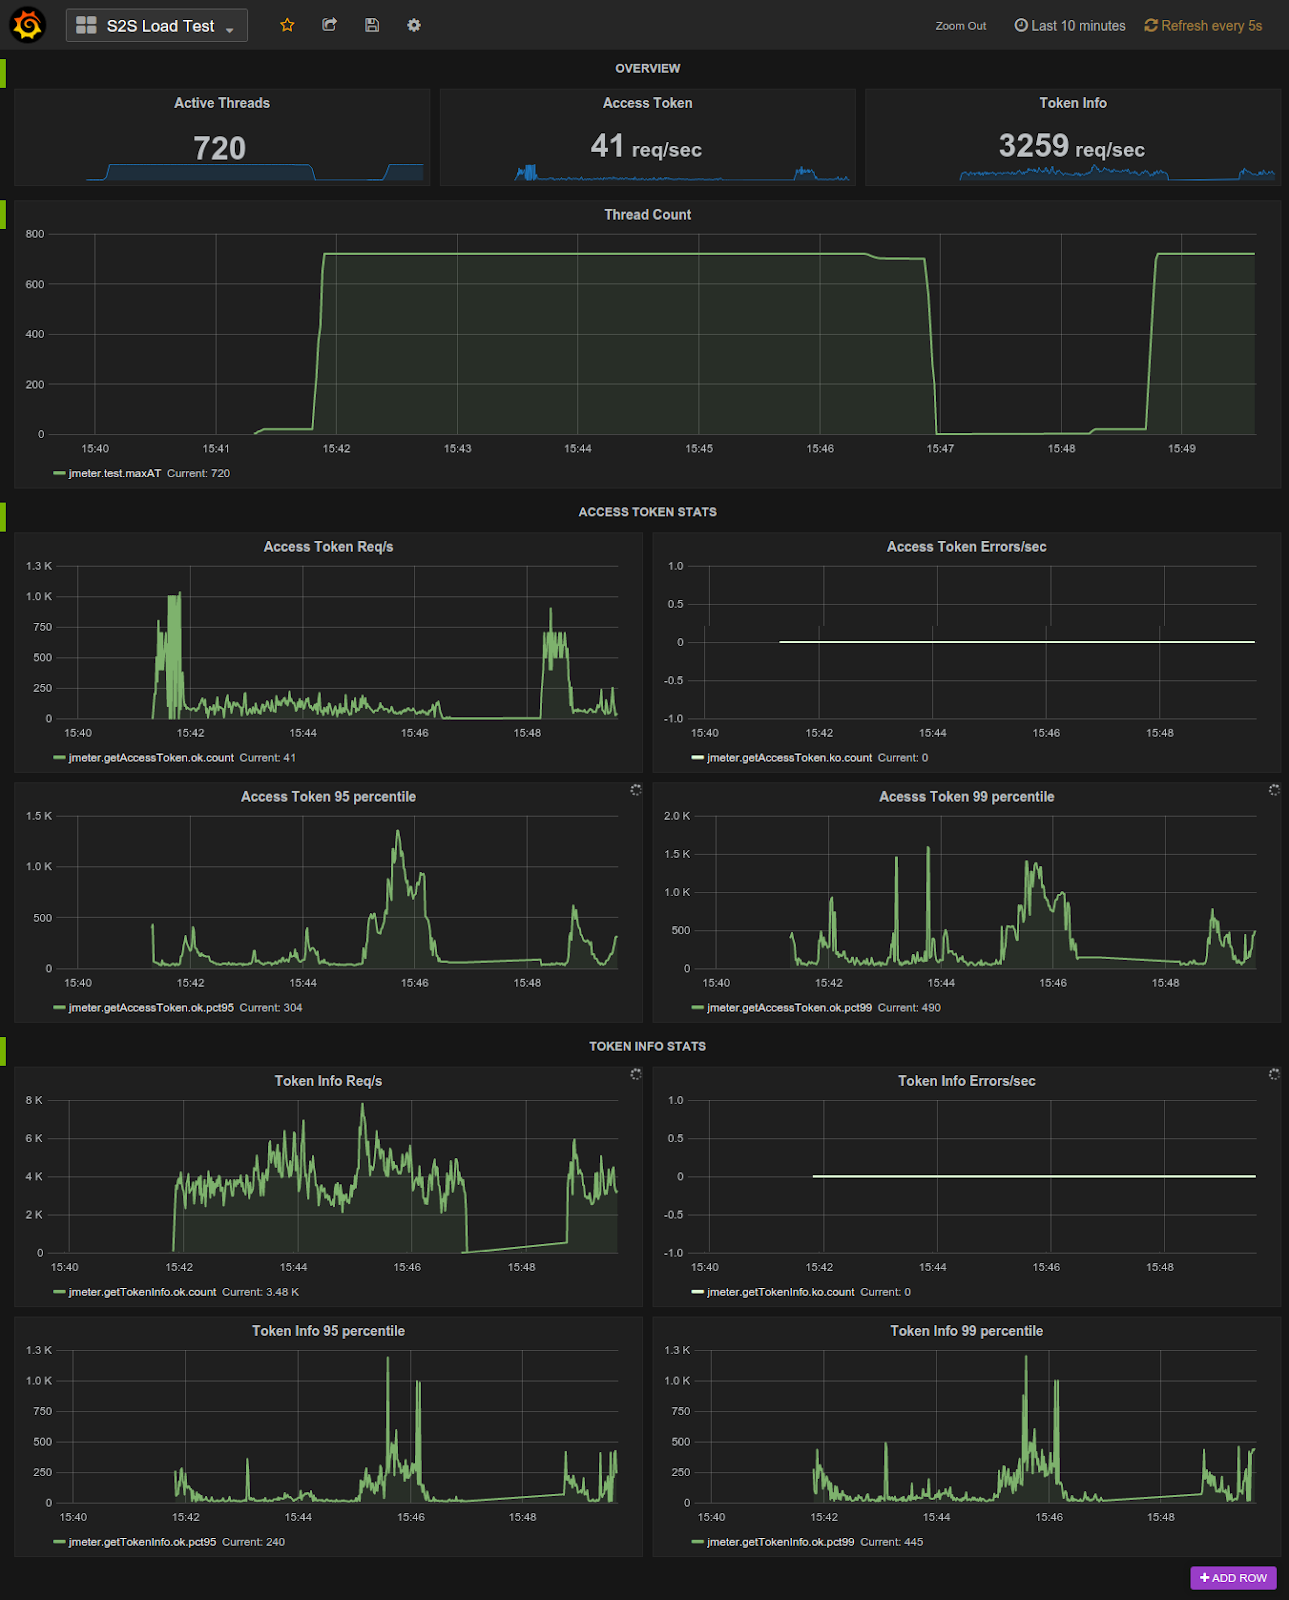
Since JMeter 2.13 Backend Listener has been available to create real time graph of JMeter Test. Following tutorial explain the entire process in detail. At the end of this tutorial you would be able to create JMeter Live Test Result dashboard similar to following -

This tutorial borrows information from many sources and my own experiments with JMeter live reporting dashboard. I have added source of information wherever applicable
But before we can build such a snazzy JMeter Live Reporting dashboard we need to understand two more components -
influxDB (a time series database) and
Grafana Dashboard
This is a big tutorial, so take deep breath :-) and follow on.
Once you complete set up specified in this tutorial then you can watch JMeter Training Video Tutorial to watch this in action.
Once you complete set up specified in this tutorial then you can watch JMeter Training Video Tutorial to watch this in action.
What is Time Series Database?
A time series is a sequence of data points, typically consisting of successive measurements made over a time interval. Examples of time series are ocean tides, counts of sunspots, and the daily closing value of the Dow Jones Industrial Average.
And we are interested in load test which also generates time series data points.
source -
A time series database handles time series data, ex - influxDB
influxDB -
InfluxDB is a time series, metrics, and analytics database. It’s written in Go and has no external dependencies. That means once you install it there’s nothing else to manage (such as Redis, ZooKeeper, Cassandra, HBase, or anything else). InfluxDB is targeted at use cases for DevOps, metrics, sensor data, and real-time analytics.
source -
InfluxDB Installation Details
To access influx db from command line interface (CLI) and use influx query language - https://influxdb.com/docs/v0.9/introduction/getting_started.html
How is data stored in influxDB?
Data in InfluxDB is organized by time series, which contain a measured value, like “cpu_load” or “temperature”. Time series have zero to many points, one for each discrete sample of the metric. Points consist of time (a timestamp), a measurement(“cpu_load”), at least one key-value field (the measured value itself, e.g. “value=0.64” or “15min=0.78”), and zero to many key-value tags containing metadata (e.g. “host=server01”, “region=EMEA”, “dc=Frankfurt”). Conceptually you can think of a measurement as an SQL table, with rows where the primary index is always time. tags and fields are effectively columns in the table. tags are indexed, fields are not. The difference is that with InfluxDB you can have millions of measurements, you don’t have to define schemas up front, and null values aren’t stored.
source -
Ex:
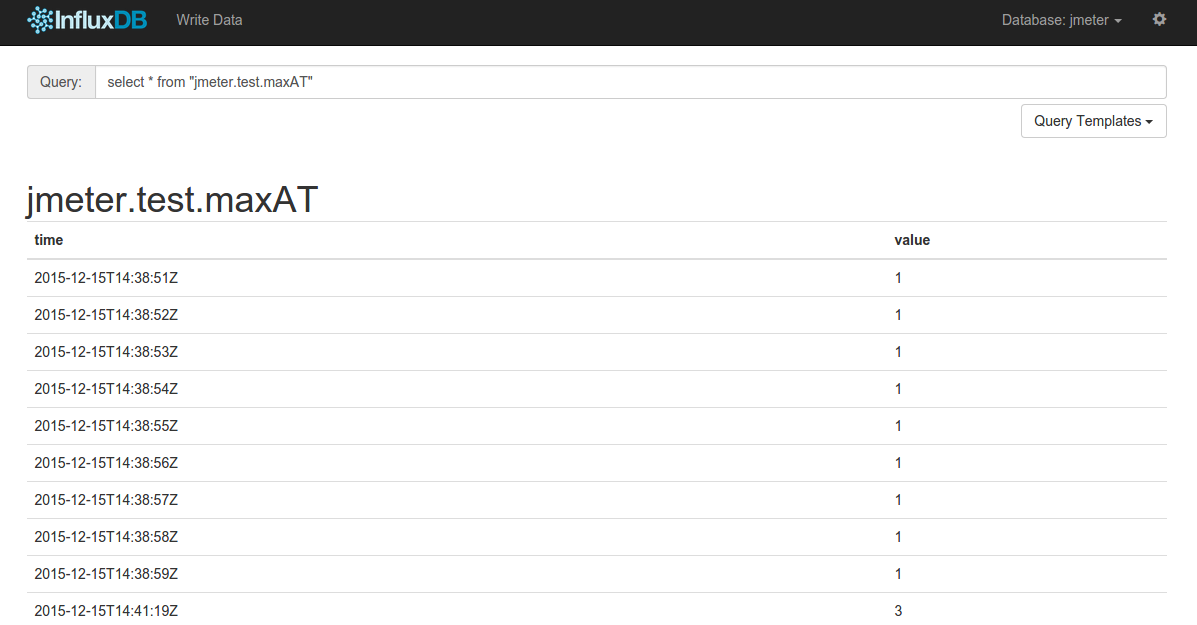
This is how JMeter max active threads data is stored in influxDB. We will see later how JMeter metrics end up in influxDB
Authentication and Authorization in influxDB -
Create at least one admin user. See the authorization section for how to create an admin user - https://influxdb.com/docs/v0.9/administration/authentication_and_authorization.html
create a non admin user as -
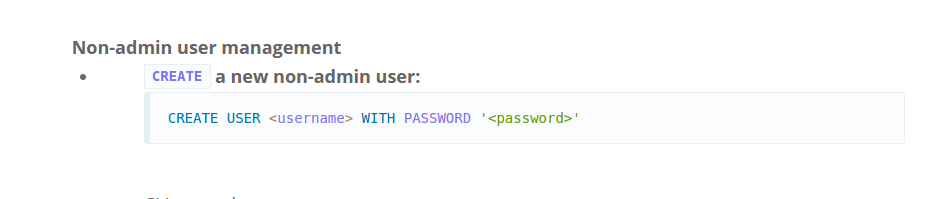
create a non admin user as -
ex - CREATE USER root WITH PASSWORD 'root’
We will use these credentials later when setting up data source in Grafana>
By default, authentication is disabled in the configuration file. Enable authentication by setting the auth-enabled option to true in the [http] section of the configuration file (/etc/opt/influxdb/influxdb.conf) -
We will use these credentials later when setting up data source in Grafana>
By default, authentication is disabled in the configuration file. Enable authentication by setting the auth-enabled option to true in the [http] section of the configuration file (/etc/opt/influxdb/influxdb.conf) -
[http]
enabled = true
bind-address = ":8086"
auth-enabled = true
log-enabled = true
write-tracing = false
pprof-enabled = false
https-enabled = false
https-certificate = "/etc/ssl/influxdb.pem"
enabled = true
bind-address = ":8086"
auth-enabled = true
log-enabled = true
write-tracing = false
pprof-enabled = false
https-enabled = false
https-certificate = "/etc/ssl/influxdb.pem"
Restart the process -
sudo service influxdb start
or specifying the config file when starting influxDB -
cd /opt/influxdb$
./influxd -config /etc/opt/influxdb/influxdb.conf
Enable Graphite listener in influxDB -
Add Graphite data to influxDB config file - (/etc/opt/influxdb/influxdb.conf)
Search for section [[graphite]] and modify it as following -
[[graphite]]
enabled = true
bind-address = ":2003"
database = jmeter
now restart influxDB as -
./influxd -config /etc/opt/influxdb/influxdb.conf
This will create JMeter database in influxdb -

The InfluxDB HTTP API runs on port 8086 by default.
The built in user interface runs on port 8083 by default.
Access influx DB at - http://localhost:8083/# and select database jmeter from dopdown as described below -

JMeter measurements in influxDB -
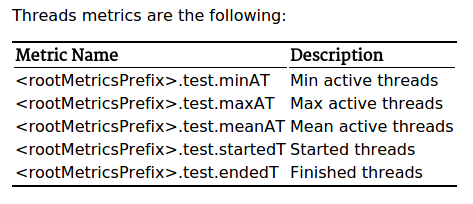
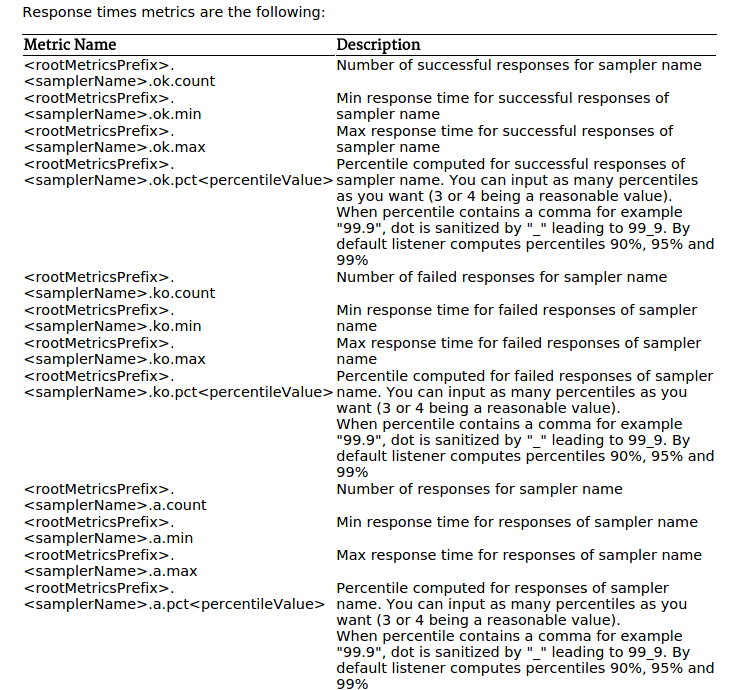
At the time of writing this doc following JMeter metrics are posted to influxDB -
Source -
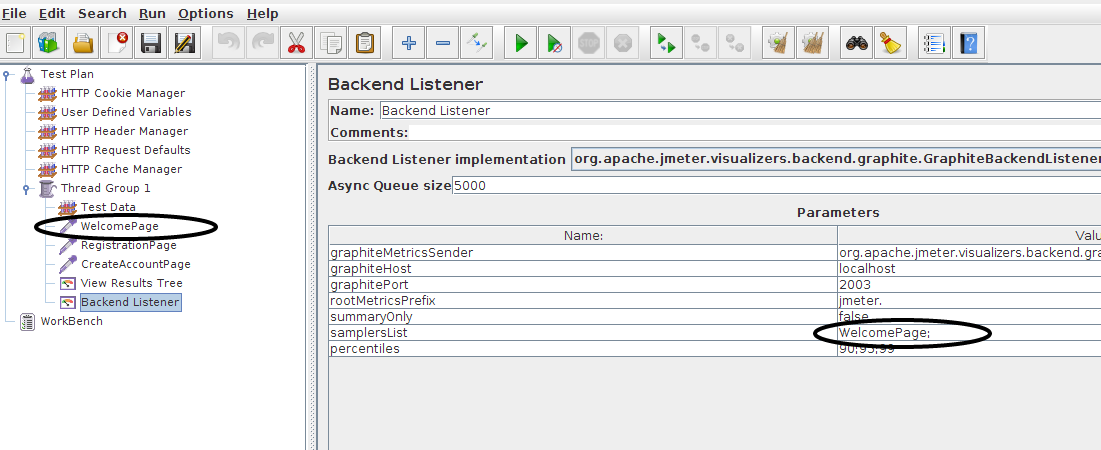
Notice that these measurements would be available only after adding BackenListener and running test at least once. Hence add Backend Listener to test plan as -

You can specify following properties in Backend Listener -

And run the test.
In all of the metric i.e. jmeter.all.a.count, jmeter.all.a.max etc word “jmeter” is rootMetricPrefix and is specified in Backend Listener
By default JMeter sends only metrics for all samplers using "all" as sampler Name so it looks like this in influxDB -

To query a measurement in influxDB you can run select query on required measurement as -

And to drop the database (you won’t do this very often ;-)) execute drop query as -
drop database <dbname>
When you need values for specific samples then specify sampler name in Backend listener and run test. (Multiple sample names as comma separated values) -
Grafana:
Grafana is a leading open source application for visualizing large-scale measurement data. It provides a powerful and elegant way to create, share, and explore data and dashboards from your disparate metric databases, either with your team or the world.
Grafana is most commonly used for Internet infrastructure and application analytics, but many use it in other domains including industrial sensors, home automation, weather, and process control.
Grafana features pluggable panels and data sources allowing easy extensibility. There is currently rich support for Graphite, InfluxDB and OpenTSDB.
source -
Grafana Installation -
Refer following doc for grafana installation - http://docs.grafana.org/installation/
Once done, then you can start grafana-server by executing
$ sudo service grafana-server start
This will start the grafana-server process as the grafana user, which was created during the package installation. The default HTTP port is 3000 and default user and password is admin.
Launch http://localhost:3000/ and login as admin/admin
Grafana config file is located under following directory -
/usr/share/grafana/conf
cat defaults.ini
Grafana Date Source -
Grafana supports many storage backend for time series data. Query Language and capabilities of each data source are different. Influxdb is one such supported data source. You can read more on Grafana Data Source here - http://docs.grafana.org/datasources/overview/
Adding a data source -
Login as admin and navigate to http://localhost:3000/datasources/new
Select Type as influxdb and specify other values -

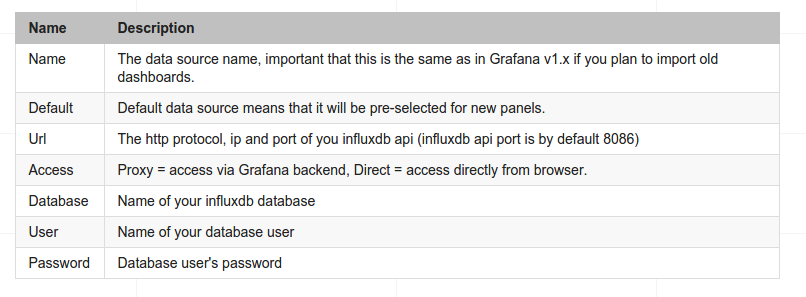
add user and password which you have set for database (root and root)
beware of some quirks ;-) https://groups.io/g/grafana/thread/datasource_connection_works/263310?p=,,,0,0,0,0:RecentPostDate,,,20,2,0,263310
Creating Grafana dashboard -
mvn test > will generate GenerateDashboard.jar
Follow instructions at ReadME file and generate Grafana dashboard.
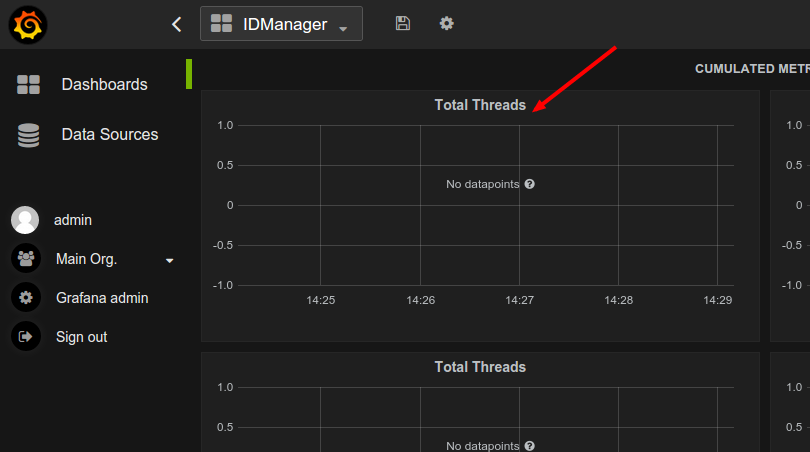
Now you can import dashboard json file to Grafana -


You can view json of each panel by clicking on head -
And now click on “Panel Json” -

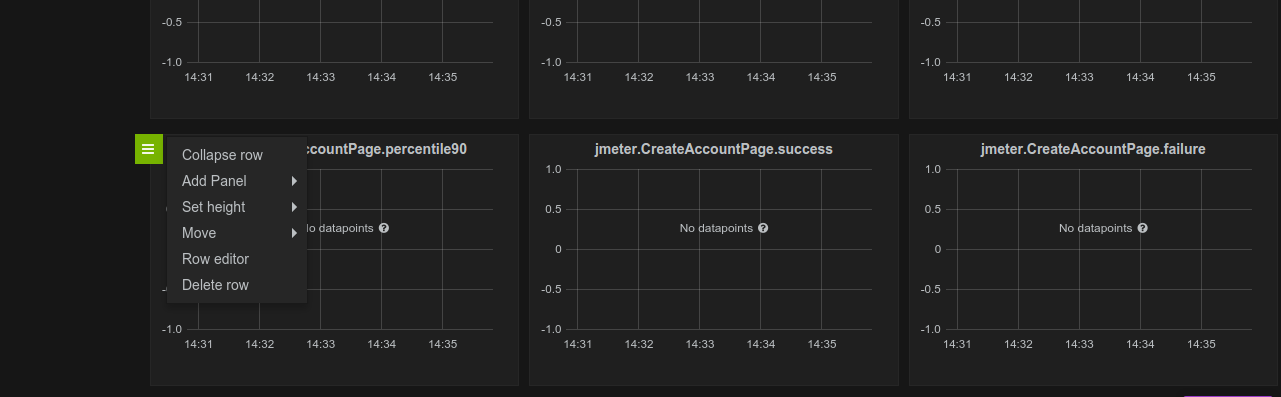
You can modify existing row by clicking on green symbol on LHS of each row
You can also a new row using “Add Row” button -

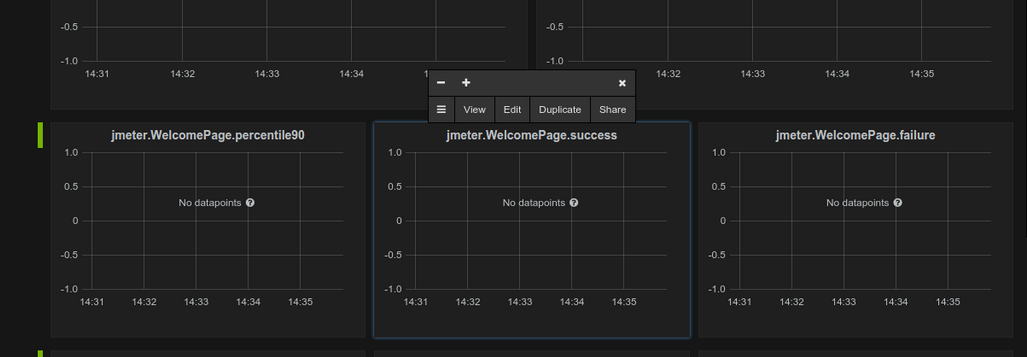
Or add a new graph to existing row using Add Panel > Graph from green bar on LHS -
Or edit an existing graph > Click top header of a graph and click Edit on panel -

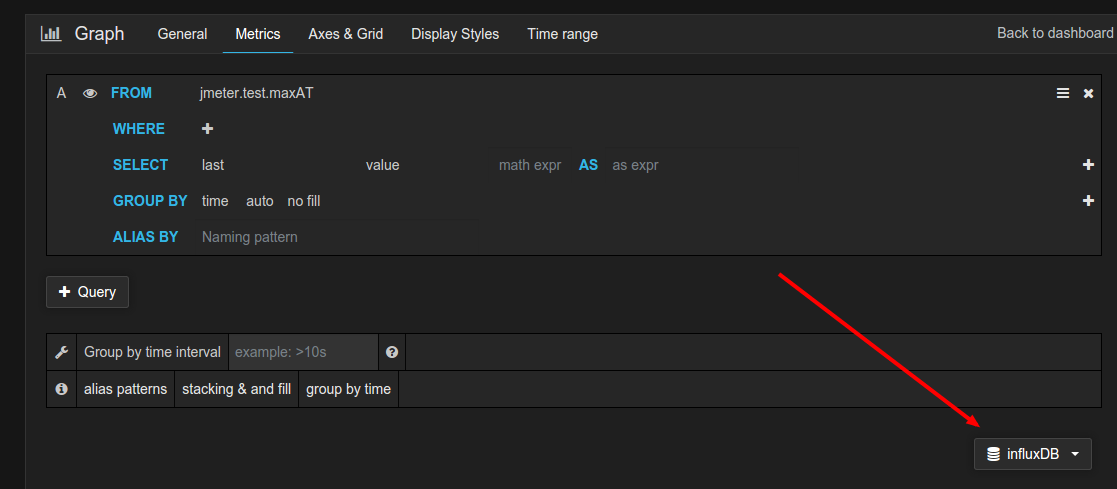
You can switch to Metrics mode which might be easy for writing queries -

Make sure that you have data source influxDB selected as -
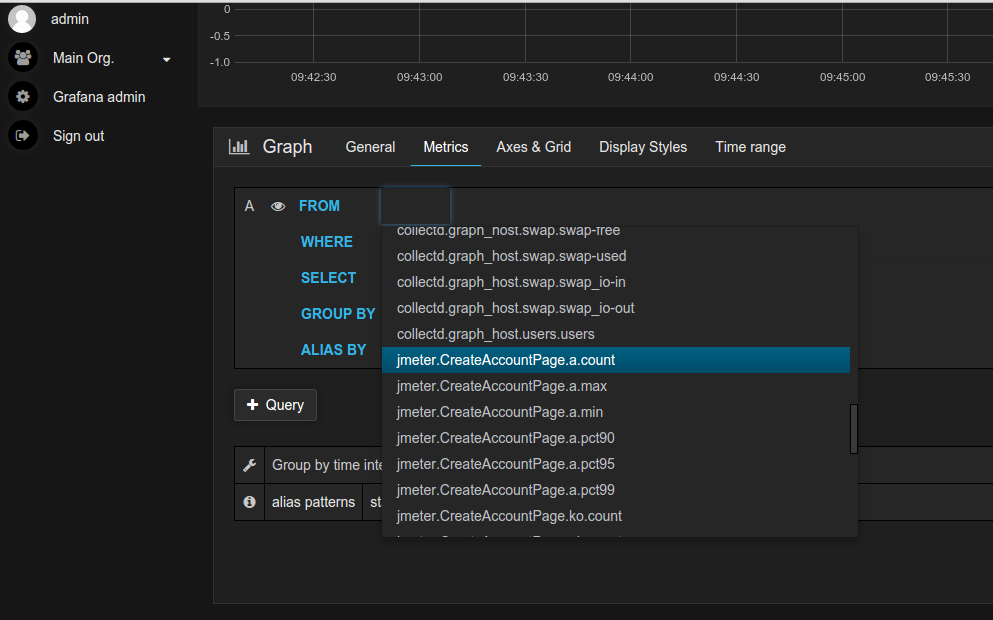
And if you DataSource connection is really successful ;-) then you would see available measurements in FROM dropdown as following -
Metrics define series data and sources to render. Each data source provides different Metrics option and we are using influxDB here.
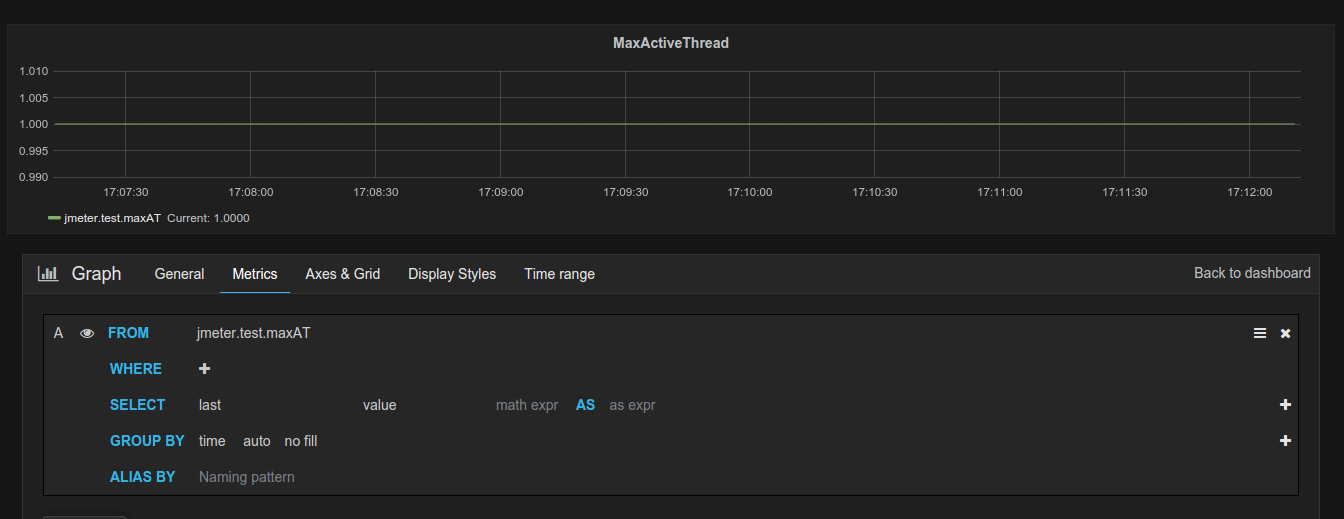
One example query to get last value of max active threads -
Along with graph, you can also add Single stat display on a row -

You can set height of Single stat using <Set height> option
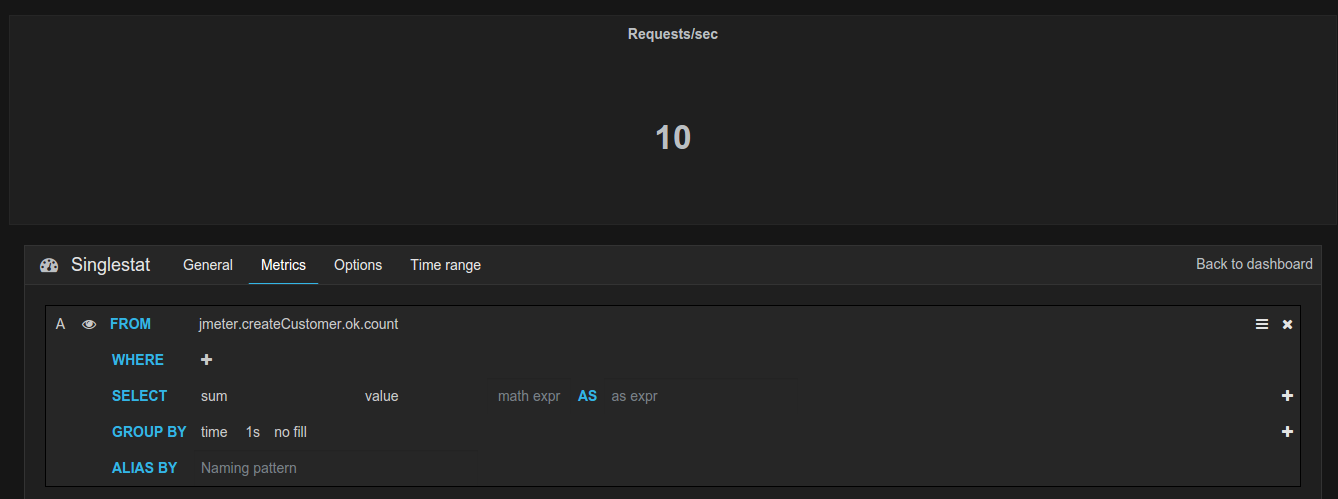
Let’s consider an example - To display throughput for a successful request, you could query sum of <samepleName>.ok.count and group it against unit of time for ex Sec as following -
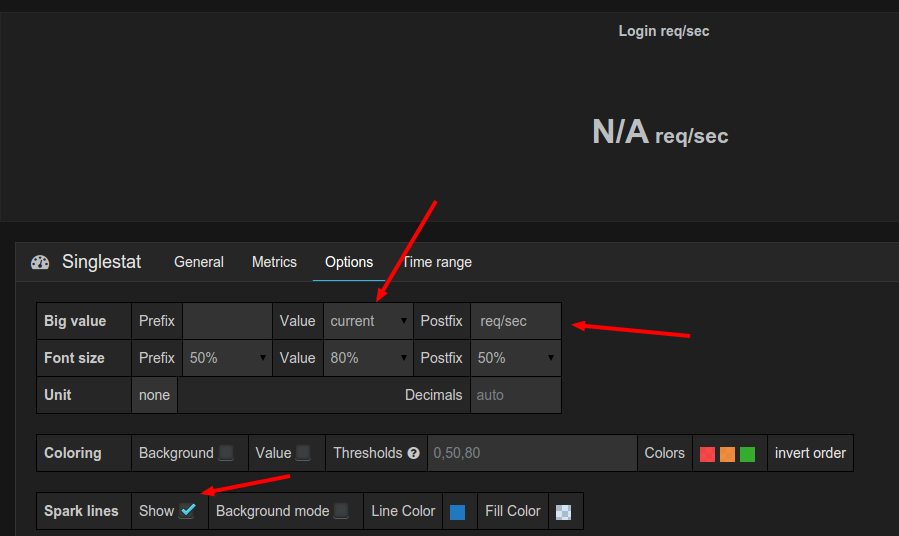
Now select <Value> as <current> in Options tab and you would display current value of req/sec -
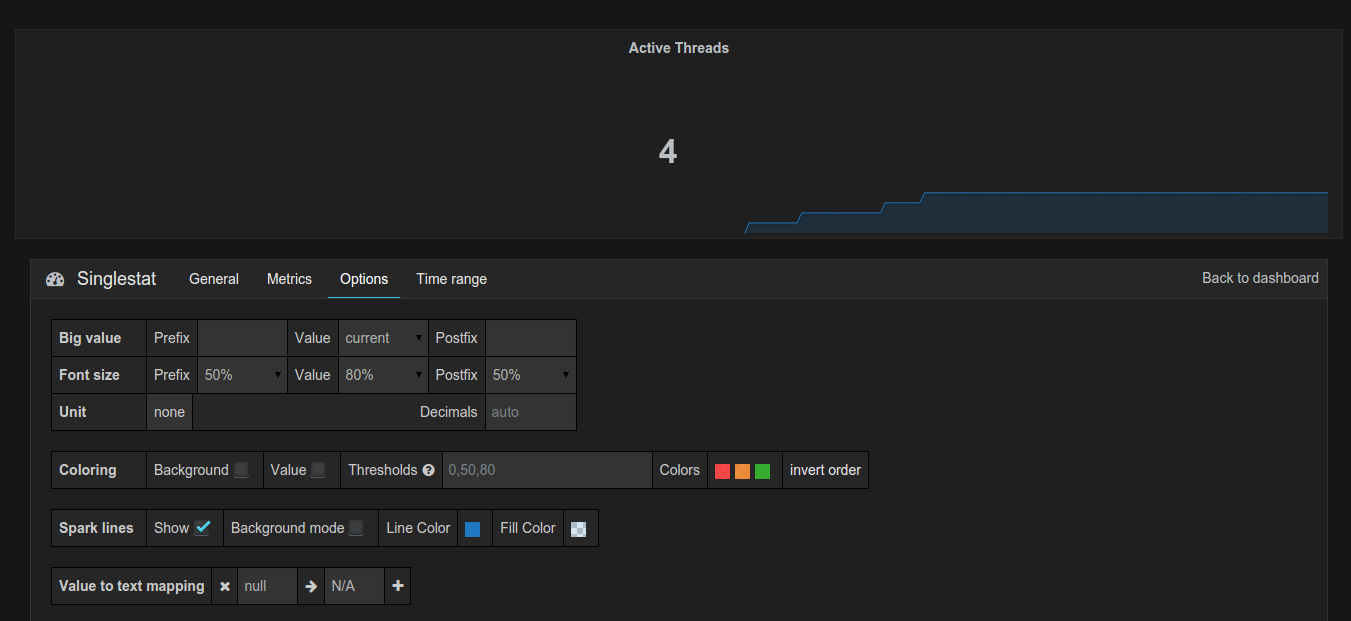
You can also choose another value to display (Min, Max, Avg), Postfix, Spark lines, Coloring etc as -
For ex, I set up following values to display current active threads -

If you want to superimpose one graph on another then you can click the +Query button and this would let to combine multiple queries -

More info on Metric options - http://docs.grafana.org/datasources/influxdb/
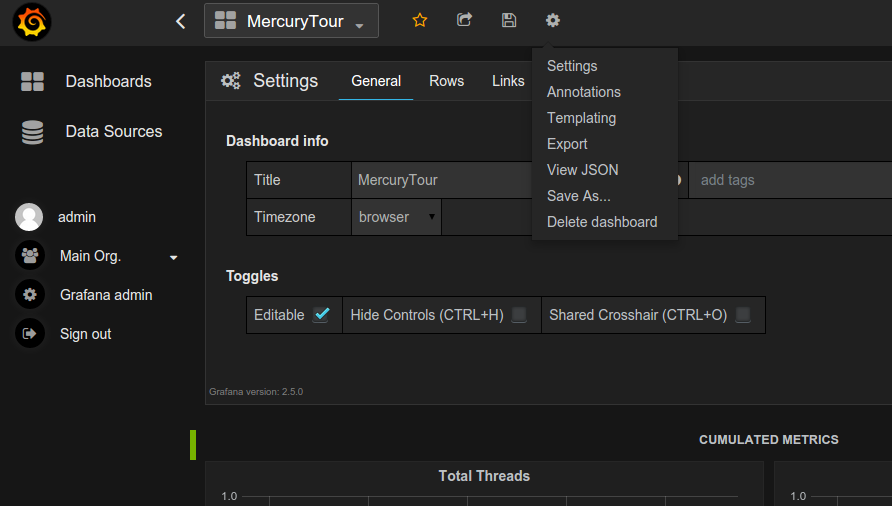
You can modify the settings of dashboard using “Settings” button -
You can modify the data collection period from top section -
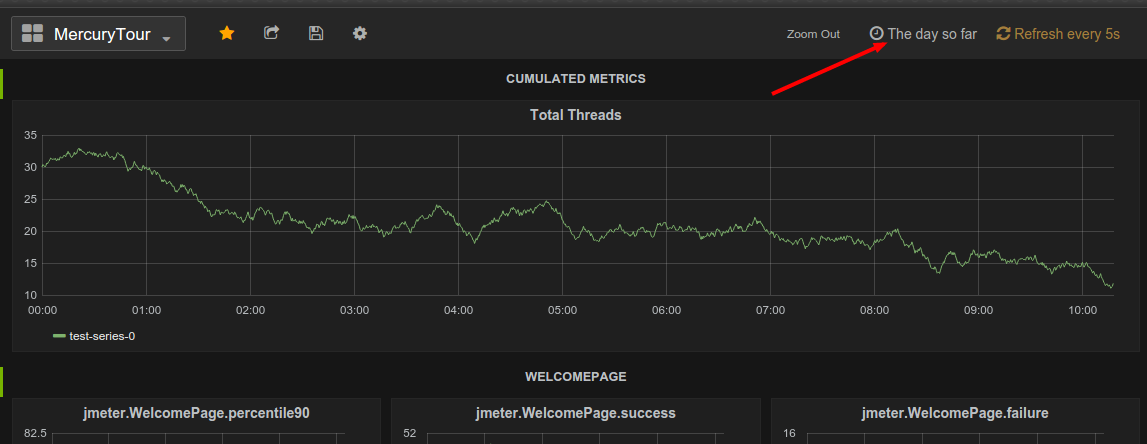
And then you can also set the refresh rate -

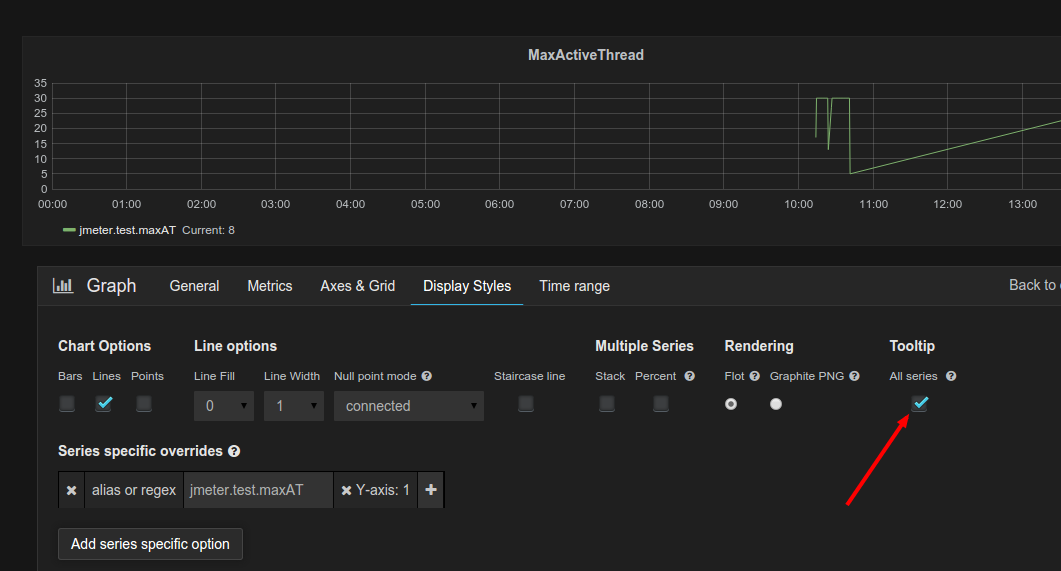
To see the value on graph when hovering over it; select Tooltip under Display Styles -
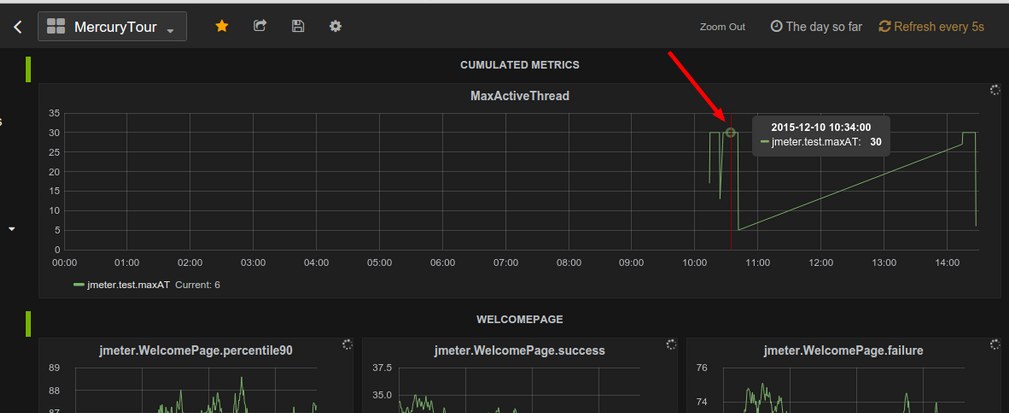
And now you would see values on graph when hovering on it -
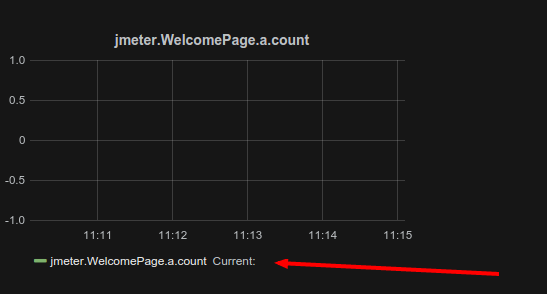
If you want current value of metric to appear the select “Current” under “Axes & Grid” -
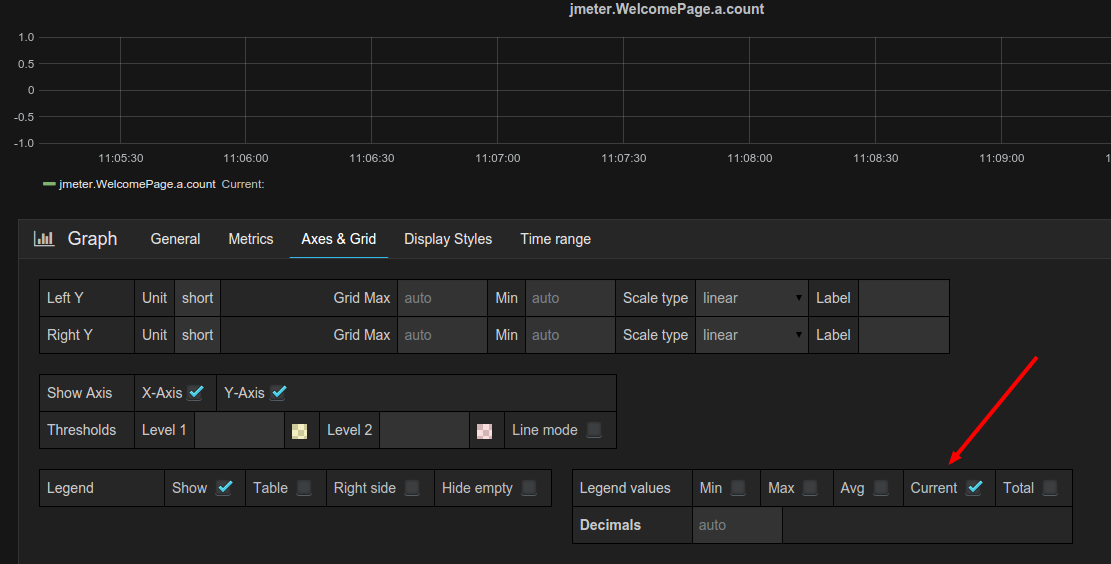
And then you would see Current value for graph -
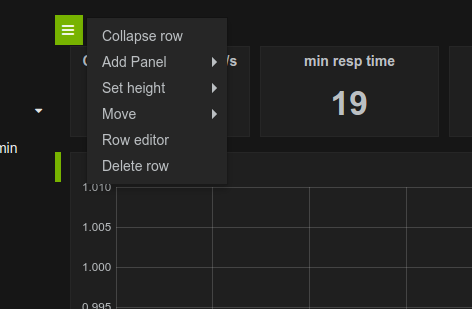
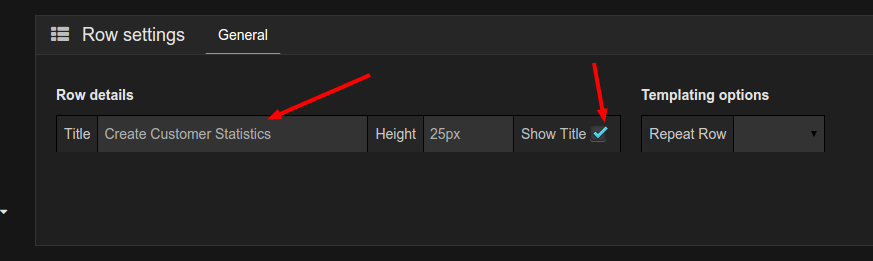
You can set header of row using Row Editor -
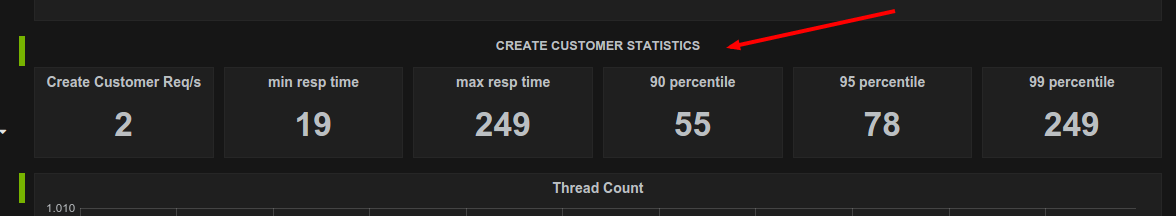
And now you would see row title on dashboard -
And in the end one of my load test dashboard looked as -
More detail on graph here - http://docs.grafana.org/reference/graph/
Did you succeed creating your own graph? Do share your experience in comment section below -