
free command and options


Free command is frontend to /proc/meminfo file. It provide more human readable output to show you the total amount of free and used physical and swap memory in the system, as well as the buffers used by the kernel:
$ free -m

vmstat command

===========================================

The vmstat, sar and iostat commands are the collection of package included in sysstat – the system monitoring tools. vmstat - Report virtual memory statistics. It reports information about processes, memory, paging, block IO, traps, disks and cpu activity. The  first report produced gives averages since the last reboot.  Additional reports give information on a sampling period of length delay.
Type the following command:
$vmstat
vmstat.png
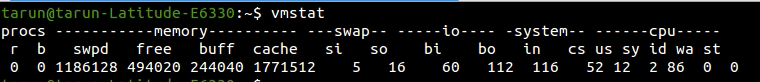
FIELD DESCRIPTION FOR VM MODE
  Procs
      r: The number of runnable processes (running or waiting for run time).
      b: The number of processes in uninterruptible sleep.
  Memory
      swpd: the amount of virtual memory used.
      free: the amount of idle memory.
      buff: the amount of memory used as buffers.
      cache: the amount of memory used as cache.
      inact: the amount of inactive memory.  (-a option)
      active: the amount of active memory.  (-a option)
  Swap
      si: Amount of memory swapped in from disk (/s).
      so: Amount of memory swapped to disk (/s).
  IO
      bi: Blocks received from a block device (blocks/s).
      bo: Blocks sent to a block device (blocks/s).
  System
      in: The number of interrupts per second, including the clock.
      cs: The number of context switches per second.
Two important fields are free under memory and si, so under swap column
  1. Free – Amount of free/idle memory spaces.
  2. si – Swapped in every second from disk in Kilo Bytes.
  3. so – Swapped out every second to disk in Kilo Bytes.
OPTIONS
delay  The delay between updates in seconds.  If no delay is specified, only one report is printed with the average values since boot.
count  Number of updates.  In absence of count, when delay is defined, default is infinite.

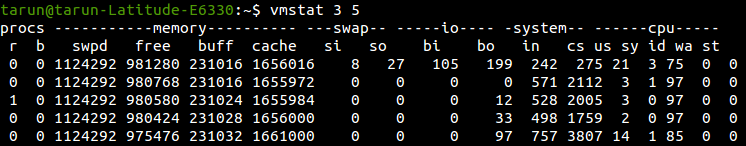
Execute vmstat ‘X’ seconds and (‘N’ number of times)

$ vmstat 3 5

With this command, vmstat execute every 3 seconds and stop after executing 5 intervals.
Screenshot from 2015-07-22 10:30:41.png

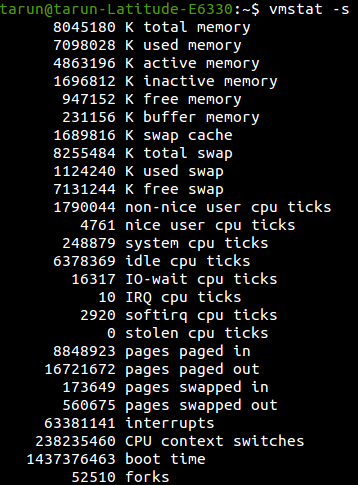
-s, --stats Displays a table of various event counters and memory statistics.  This display does not repeat.
$ vmstat -s
Screenshot from 2015-07-22 10:32:12.png
-S, --unit character Switches outputs between 1000 (k), 1024 (K), 1000000 (m), or 1048576 (M) bytes.  Note this does not change the swap (si/so) or block
             (bi/bo) fields.
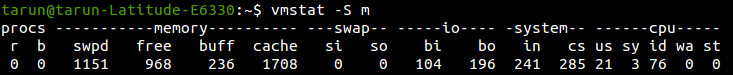
The vmstat displays in Megabytes with parameters -S and m. By default vmstat displays statistics in kilobytes.
$ vmstat -S m
Screenshot from 2015-07-22 10:36:29.png
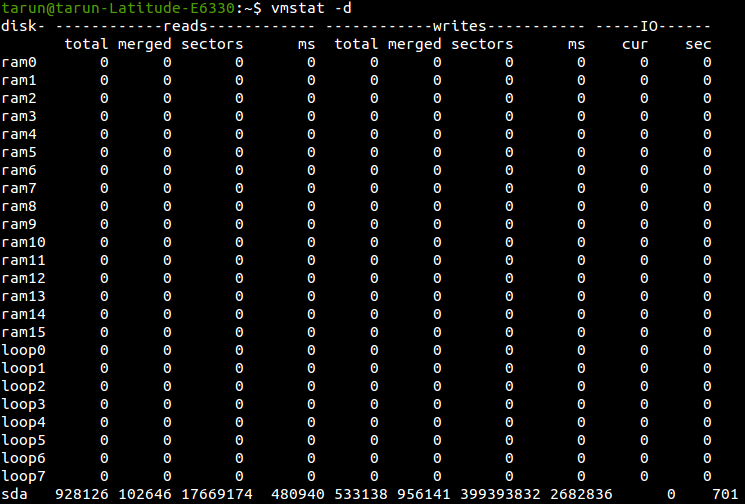
    -d, --disk Report disk statistics
        $ vmstat -d
        Screenshot from 2015-07-22 10:42:07.png

Popular posts from this blog

Selenium Tutorial: Ant Build for Selenium Java project

Ant is a build tool which could be used to have your tests running either from command line or from Hudson CI tool. There is detailed documentation available for ant here but probably you need to know only a little part of it for you selenium tests. The essentials which are needed to know are: Project Target (ant execution point and collection of tasks) Tasks (could be as simple as compilation) And there would usually be following targets for Selenium tools - setClassPath - so that ant knows where you jar files are loadTestNG - so that you could use testng task in ant and use it to execute testng tests from ant init - created the build file clean - delete the build file compile - compiles the selenium tests run - executes the selenium tests Here is my project set up for ant -

Verify email confirmation using Selenium

Note: If you are new to java and selenium then start with selenium java training videos .     Email confirmation seems to be integral part of any registration process. I came across an application which lets you provide your email address. You can follow the sign up link in you mail and then complete the registration process. Lets consider we provide GMail address for it. Now if were to use only Selenium then we would have to follow following steps - Launch GMail using Selenium; Some how search for new mail in the list of available mails; Some how click on it; Parse the mail message; Get the registration link; Follow up with registration process What do you think of an approach in which you can

Real Time JMeter Result Using Backend Listener

Since JMeter 2.13 Backend Listener has been available to create real time graph of JMeter Test. Following tutorial explain the entire process in detail. At the end of this tutorial you would be able to create JMeter Live Test Result dashboard similar to following - This tutorial borrows information from many sources and my own experiments with JMeter live reporting dashboard. I have added source of information wherever applicable But before we can build such a snazzy JMeter Live Reporting dashboard we need to understand two more components - influxDB (a time series database) and Grafana Dashboard This is a big tutorial, so take deep breath :-) and follow on. Once you complete set up specified in this tutorial then you can watch JMeter Training Video Tutorial to watch this in action. What is Time Series Database? A time series is a sequence of data points , typically consisting of successive measurements made over a time interval . Examples of time ...