
When Test Automation Fails and exploratory Testing rocks

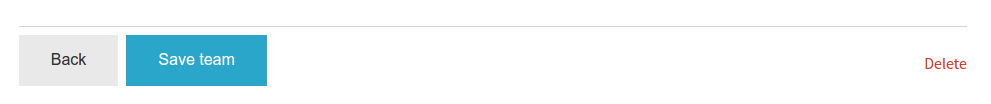
This post describes how I discovered a defect which allowed me to gain higher privilege than I was supposed to as a normal user. When testing an application I came across a use case when a privileged user would be allowed to delete a team and non privileged user would not be. Delete operation is controlled by displaying of a link. This is how it looks like for a privileged user -


Screenshot from 2016-05-30 15:37:05.png


And this is how it look for a non privileged user -


Screenshot from 2016-05-30 15:38:02.png


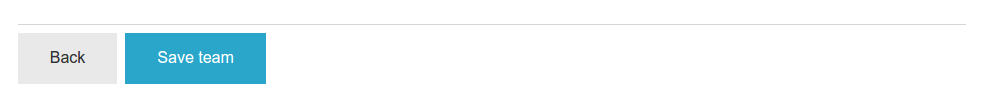
Here “Delete team” link is missing for non privileged user.

Having a look at html source code, I found following for the privileged user -


<a class="delete right" data-bind="if: teamProfile().type() != 'official', click: deleteTeam" href="https://test.com/" title="Delete this team">Delete team...</a>


And following for the non privileged user -


         <a class="delete right" data-bind="if: teamProfile().type() != 'official', click: deleteTeam" href="https://test.com/" title="Delete this team"></a>


The only difference is the missing inner text for delete link for non privileged user. Hence I modified the delete link of non privileged user as -


<a class="delete right" data-bind="if: teamProfile().type() != 'official', click: deleteTeam" href="https://draft.blogger.com/null" title="Delete this team">Delete</a>


This brought the Delete link on front end which was missing on previous snapshot -


Screenshot from 2016-05-30 15:45:21.png


When clicked on Delete link then voila, I got the confirmation prompt message of team deletion -


Screenshot from 2016-05-30 15:45:50.png

I was automating this use case by verifying the absence of delete link for non privileged user. Which would run perfect without reporting any bug. But we can see from example above that doing a little exploratory testing helped uncovered a defect which would have been missed from automated tests :-)


Do you have a similar story to share when automated testing helped you uncover a defect?

Popular posts from this blog

Selenium Tutorial: Ant Build for Selenium Java project

Ant is a build tool which could be used to have your tests running either from command line or from Hudson CI tool. There is detailed documentation available for ant here but probably you need to know only a little part of it for you selenium tests. The essentials which are needed to know are: Project Target (ant execution point and collection of tasks) Tasks (could be as simple as compilation) And there would usually be following targets for Selenium tools - setClassPath - so that ant knows where you jar files are loadTestNG - so that you could use testng task in ant and use it to execute testng tests from ant init - created the build file clean - delete the build file compile - compiles the selenium tests run - executes the selenium tests Here is my project set up for ant -

Verify email confirmation using Selenium

Note: If you are new to java and selenium then start with selenium java training videos .     Email confirmation seems to be integral part of any registration process. I came across an application which lets you provide your email address. You can follow the sign up link in you mail and then complete the registration process. Lets consider we provide GMail address for it. Now if were to use only Selenium then we would have to follow following steps - Launch GMail using Selenium; Some how search for new mail in the list of available mails; Some how click on it; Parse the mail message; Get the registration link; Follow up with registration process What do you think of an approach in which you can

Real Time JMeter Result Using Backend Listener

Since JMeter 2.13 Backend Listener has been available to create real time graph of JMeter Test. Following tutorial explain the entire process in detail. At the end of this tutorial you would be able to create JMeter Live Test Result dashboard similar to following - This tutorial borrows information from many sources and my own experiments with JMeter live reporting dashboard. I have added source of information wherever applicable But before we can build such a snazzy JMeter Live Reporting dashboard we need to understand two more components - influxDB (a time series database) and Grafana Dashboard This is a big tutorial, so take deep breath :-) and follow on. Once you complete set up specified in this tutorial then you can watch JMeter Training Video Tutorial to watch this in action. What is Time Series Database? A time series is a sequence of data points , typically consisting of successive measurements made over a time interval . Examples of time ...