
Strange QTP Errors and Possible Solutions

Herein I have listed couple of error which I encountered while working with QTP. Some of these are very cryptic and you just can not guess about their Raison d'être.I have listed these errors
hoping it would help a new bird.


Error while opening Test
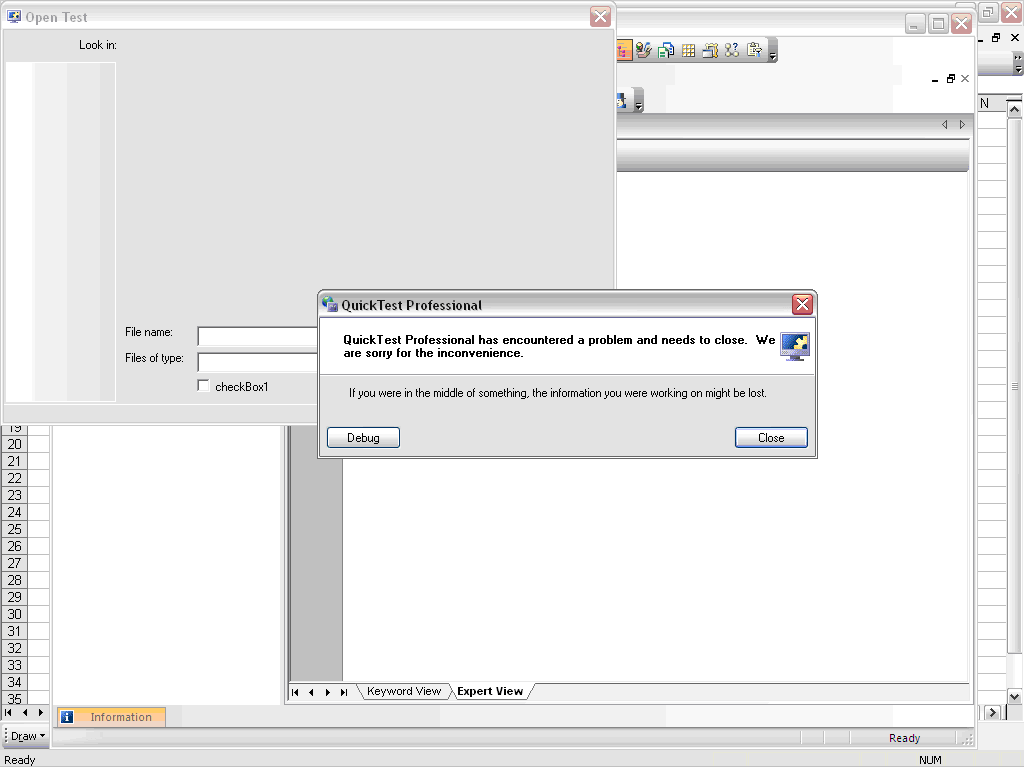


On Debug


Error with Function

Error while using a function whose definition was not available in Action


Unable to work with IE

Unable to recognize IE window; had to restart the browser


General Run Error

There have been multiple instances of General Run Error with QTP; they just don’t let u know as to what went wrong. On such instance is when I was mistakenly trying to check a check box which was disabled. Instead of General Run Error, there could have been a more comprehensible error like – “object is disabled…”


Comments

Popular posts from this blog

Verify email confirmation using Selenium WebDriver

Note: If you are new to java and selenium then start with selenium java training videos .   How to Verify Email Confirmation Using Selenium 4 and JavaMail (2026 Guide) Email confirmation is a critical part of most registration flows — account activation, password reset, multi-factor authentication, and onboarding. Every automation engineer eventually faces the same challenge: How do you verify an email confirmation link inside a Selenium test without making it slow and flaky? The wrong instinct is to automate Gmail's UI with Selenium. It's fragile, slow, and breaks constantly. The right approach: Use Selenium for browser automation Use JavaMail (IMAP) to read the email directly Extract the confirmation link Continue the test in Selenium Why Not Automate Gmail UI With Selenium? Automating the Gmail UI means logging in, searching, clicking a message, and parsing content from a third-party interface that changes frequently. This leads to: Flaky...

Real Time JMeter Result Using Backend Listener

Since JMeter 2.13 Backend Listener has been available to create real time graph of JMeter Test. Following tutorial explain the entire process in detail. At the end of this tutorial you would be able to create JMeter Live Test Result dashboard similar to following - This tutorial borrows information from many sources and my own experiments with JMeter live reporting dashboard. I have added source of information wherever applicable But before we can build such a snazzy JMeter Live Reporting dashboard we need to understand two more components - influxDB (a time series database) and Grafana Dashboard This is a big tutorial, so take deep breath :-) and follow on. Once you complete set up specified in this tutorial then you can watch JMeter Training Video Tutorial to watch this in action. What is Time Series Database? A time series is a sequence of data points , typically consisting of successive measurements made over a time interval . Examples of time ...

Should you be using Distributed Testing for Performance Testing ?

Having posted elaborately on how to carry out JMeter distributed and using Jmeter Backend listener to plot live graph of running test. I have been disappointed with entire approach. And my disappointment is not limited to just JMeter as any other performance testing tool would suffer from similar factors. Distributed test itself results in lower throughput than what you can achieve from test running from independent machine. This is described on http://www.http503.com/2012/jmeter-ec2/ (unfortunately web site is down for quite some time). I am pasting the reasoning here - If you want to use your local machine to control the test you have to navigate the joyous process of getting RMI to work over multiple subnets and firewalls to allow your local machine to control multiple remote (EC2) slaves – you can do this by tunnelling RMI communication and patching JMeter, it’s messy though. To workaround this issue you have to use a remote Master as well as remote Slaves. Even then...