
free command and options


Free command is frontend to /proc/meminfo file. It provide more human readable output to show you the total amount of free and used physical and swap memory in the system, as well as the buffers used by the kernel:
$ free -m

vmstat command

===========================================

The vmstat, sar and iostat commands are the collection of package included in sysstat – the system monitoring tools. vmstat - Report virtual memory statistics. It reports information about processes, memory, paging, block IO, traps, disks and cpu activity. The  first report produced gives averages since the last reboot.  Additional reports give information on a sampling period of length delay.
Type the following command:
$vmstat

vmstat.png
FIELD DESCRIPTION FOR VM MODE
  Procs
      r: The number of runnable processes (running or waiting for run time).
      b: The number of processes in uninterruptible sleep.
  Memory
      swpd: the amount of virtual memory used.
      free: the amount of idle memory.
      buff: the amount of memory used as buffers.
      cache: the amount of memory used as cache.
      inact: the amount of inactive memory.  (-a option)
      active: the amount of active memory.  (-a option)
  Swap
      si: Amount of memory swapped in from disk (/s).
      so: Amount of memory swapped to disk (/s).
  IO
      bi: Blocks received from a block device (blocks/s).
      bo: Blocks sent to a block device (blocks/s).
  System
      in: The number of interrupts per second, including the clock.
      cs: The number of context switches per second.
Two important fields are free under memory and si, so under swap column
  1. Free – Amount of free/idle memory spaces.
  2. si – Swapped in every second from disk in Kilo Bytes.
  3. so – Swapped out every second to disk in Kilo Bytes.
OPTIONS
delay  The delay between updates in seconds.  If no delay is specified, only one report is printed with the average values since boot.
count  Number of updates.  In absence of count, when delay is defined, default is infinite.

Execute vmstat ‘X’ seconds and (‘N’ number of times)

$ vmstat 3 5

With this command, vmstat execute every 3 seconds and stop after executing 5 intervals.

Screenshot from 2015-07-22 10:30:41.png

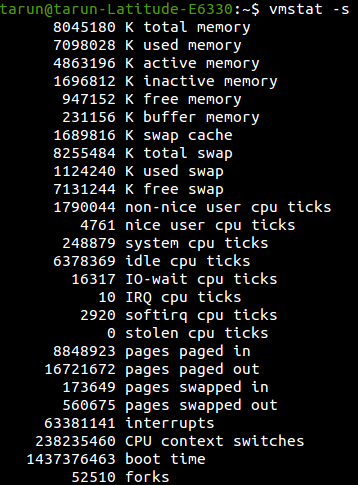
-s, --stats Displays a table of various event counters and memory statistics.  This display does not repeat.
$ vmstat -s
Screenshot from 2015-07-22 10:32:12.png
-S, --unit character Switches outputs between 1000 (k), 1024 (K), 1000000 (m), or 1048576 (M) bytes.  Note this does not change the swap (si/so) or block
             (bi/bo) fields.
The vmstat displays in Megabytes with parameters -S and m. By default vmstat displays statistics in kilobytes.
$ vmstat -S m

Screenshot from 2015-07-22 10:36:29.png
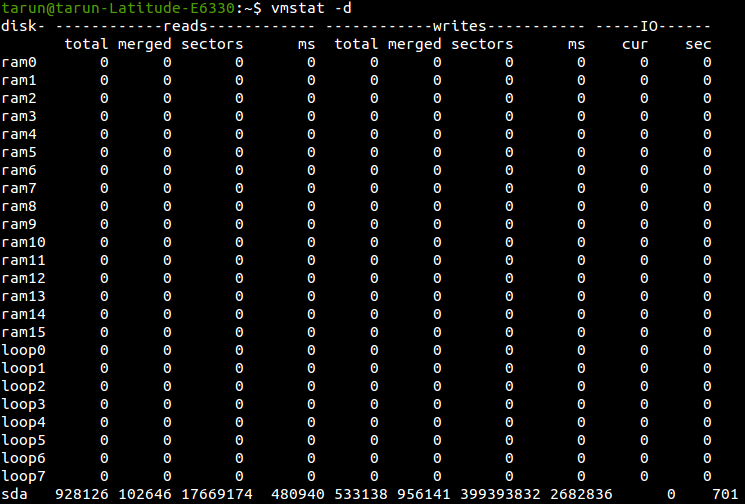
    -d, --disk Report disk statistics
        $ vmstat -d
        Screenshot from 2015-07-22 10:42:07.png

Popular posts from this blog

Verify email confirmation using Selenium WebDriver

Note: If you are new to java and selenium then start with selenium java training videos .   How to Verify Email Confirmation Using Selenium 4 and JavaMail (2026 Guide) Email confirmation is a critical part of most registration flows — account activation, password reset, multi-factor authentication, and onboarding. Every automation engineer eventually faces the same challenge: How do you verify an email confirmation link inside a Selenium test without making it slow and flaky? The wrong instinct is to automate Gmail's UI with Selenium. It's fragile, slow, and breaks constantly. The right approach: Use Selenium for browser automation Use JavaMail (IMAP) to read the email directly Extract the confirmation link Continue the test in Selenium Why Not Automate Gmail UI With Selenium? Automating the Gmail UI means logging in, searching, clicking a message, and parsing content from a third-party interface that changes frequently. This leads to: Flaky...

Using xPath to reach parent of an element

Note: If you are new to java and selenium then start with selenium java training videos .   I generally prefer CSS selectors over XPath when writing Selenium locators. CSS selectors are concise, readable, and usually provide everything I need. However, there are situations where XPath is a better fit—particularly when I need to navigate through an element's hierarchy, such as moving from an element to its parent, grandparent, or sibling. This post shows one such real-world example. The Problem I came across a situation where I needed to click a link based on the value of an input field. The HTML structure contained multiple similar groups of elements. The input field and the link I wanted to click were not directly related, but they shared a common parent structure. In the following example above, the input element is highlighted, and I need to click the corresponding anchor ( <a> ) element . The challenge is that there may be multiple similar structures on the page. I th...

Real Time JMeter Result Using Backend Listener

Since JMeter 2.13 Backend Listener has been available to create real time graph of JMeter Test. Following tutorial explain the entire process in detail. At the end of this tutorial you would be able to create JMeter Live Test Result dashboard similar to following - This tutorial borrows information from many sources and my own experiments with JMeter live reporting dashboard. I have added source of information wherever applicable But before we can build such a snazzy JMeter Live Reporting dashboard we need to understand two more components - influxDB (a time series database) and Grafana Dashboard This is a big tutorial, so take deep breath :-) and follow on. Once you complete set up specified in this tutorial then you can watch JMeter Training Video Tutorial to watch this in action. What is Time Series Database? A time series is a sequence of data points , typically consisting of successive measurements made over a time interval . Examples of time ...